


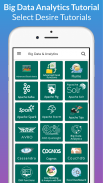




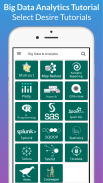

Learn All Big Data Analytics Tutorial Offline 2020

Learn All Big Data Analytics Tutorial Offline 2020介绍
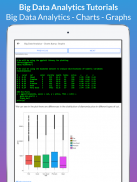
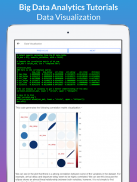
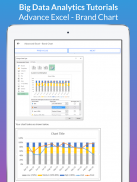
Learn Advanced Excel Charts
Excel charts are an efficient means to visualize the data to convey the results in 2020.
Learn Advanced Excel Functions
This Microsoft Excel tutorial teaches you how to create and use Excel functions. You can use Excel functions to perform various mathematical, statistical, logical calculations by 2020.
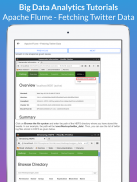
Learn Apache Flume
Flume is a standard, simple, robust, flexible, and extensible tool for data ingestion from various data producers (webservers) into Hadoop. In this tutorial,
Learn Apache Kafka
Apache Kafka was originated at LinkedIn and later became an open sourced Apache project in 2011, then First-class Apache project in 2012.
Apache Pig is an abstraction over MapReduce. It is a tool/platform which is used to analyze larger sets of data representing them as data flows
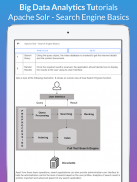
Learn Apache Solr
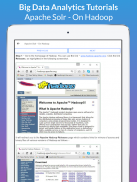
Solr is a scalable, ready to deploy, search/storage engine optimized to search large volumes of text-centric data 2020.
Learn Apache Spark
Apache Spark is a lightning-fast cluster computing designed for fast computation.
Learn Apache Storm
Storm was originally created by Nathan Marz and team at BackType. BackType is a social analytics company.
Learn Apache Tajo
Apache Tajo is an open-source distributed data warehouse framework for Hadoop.
Learn Avro
Apache Avro is a language-neutral data serialization system, developed by Doug Cutting, the father of Hadoop.
Learn AWS Quicksight
AWS Quicksight is an AWS based Business Intelligence and visualization tool
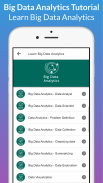
Learn Big Data Analytics
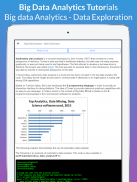
The volume of data that one has to deal has exploded to unimaginable levels in the past decade, and at the same time, the price of data storage has systematically reduced. Private companies and research institutions capture terabytes of data about their users’ interactions, business, social media, and also sensors from devices such as mobile phones and automobiles.
Learn Excel Dax
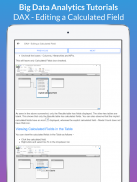
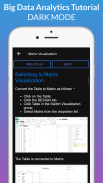
DAX (Data Analysis Expressions) is a formula language that helps you create new information from the data that already exists in your Data Model
Learn Excel Data Analysis
Data Analysis with Excel is a comprehensive tutorial that provides a good insight into the latest and advanced features available in Microsoft Excel.
Learn Excel Pivot Tables
PivotTable is an extremely powerful tool that you can use to slice and dice data.
Learn Excel Macros
An Excel macro is an action or a set of actions that you can record, give a name, save and run as many times as you want and whenever you want.
Learn Excel Power Pivot
Excel Power Pivot is an efficient, powerful tool that comes with Excel as an Add-in.
Learn Excel Power View
Power View enables interactive data exploration, visualization, and presentation that encourages intuitive ad-hoc reporting.
Learn Google Charts
Google Charts is a pure JavaScript based charting library meant to enhance web applications by adding interactive charting capability.
Learn Hadoop
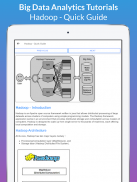
Hadoop is an open-source framework that allows to store and process big data in a distributed environment across clusters of computers using simple programming models.
Learn Power BI
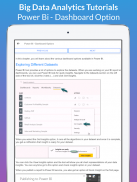
Power BI is a Data Visualization and Business Intelligence tool that converts data from different data sources to interactive dashboards and BI reports.
Learn QlikView
QlikView is a leading Business Discovery Platform.
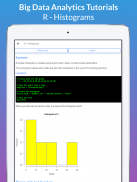
Learn R Programming
R is a programming language and software environment for statistical analysis, graphics representation and reporting.
Learn SAS
SAS is a leader in business analytics. Through innovative analytics it caters to business intelligence and data management software and services.
Learn Spark SQL
Apache Spark is a lightning-fast cluster computing designed for fast computation. It was built on top of Hadoop.
Learn Statistics
This Statistics preparation material will cover the important concepts of Statistics syllabus. It contains chapters discussing all the basic concepts of Statistics with suitable
了解高级Excel图表
Excel图表是可视化数据以传达2020年结果的有效手段。
了解高级Excel功能
本Microsoft Excel教程教您如何创建和使用Excel函数。您可以使用Excel函数在2020年之前执行各种数学,统计,逻辑计算。
学习Apache Flume
Flume是一种标准,简单,健壮,灵活且可扩展的工具,用于将数据从各种数据生产者(Web服务器)提取到Hadoop中。在本教程中,
学习Apache Kafka
Apache Kafka起源于LinkedIn,后来在2011年成为开源Apache项目,然后在2012年成为First-class Apache项目。
Apache Pig是MapReduce的抽象。它是一个工具/平台,用于分析将较大的数据集表示为数据流的数据
学习Apache Solr
Solr是一个可扩展,易于部署的搜索/存储引擎,经过优化可搜索大量以文本为中心的数据2020。
学习Apache Spark
Apache Spark是专为快速计算而设计的闪电般的集群计算。
学习Apache Storm
Storm最初是由 Nathan Marz 及其团队 BackType 创建的。 BackType是一家社交分析公司。
学习Apache Tajo
Apache Tajo是用于Hadoop的开源分布式数据仓库框架。
学习Avro
Apache Avro 是与语言无关的数据序列化系统,由Hadoop之父 Doug Cutting 开发。
了解AWS Quicksight
AWS Quicksight是基于AWS的商业智能和可视化工具
了解大数据分析
在过去的十年中,必须处理的数据量激增至难以想象的水平,与此同时,数据存储的价格已系统地降低了。私人公司和研究机构从其手机,汽车等设备中捕获有关其用户交互,业务,社交媒体以及传感器的TB级数据。
学习Excel Dax
DAX(数据分析表达式)是一种公式语言,可以帮助您从数据模型中已经存在的数据中创建新信息
了解Excel数据分析
使用Excel进行数据分析是一本综合性的教程,可深入了解Microsoft Excel中提供的最新和高级功能。
了解Excel数据透视表
数据透视表是一种非常强大的工具,可用于对数据进行切片和切块。
了解Excel宏
Excel宏是可以记录,指定名称,保存和运行任意次或多次的操作或一组操作。
了解Excel Power Pivot
Excel Power Pivot是Excel的外接程序,是一种高效,强大的工具。
了解Excel Power View
Power View支持交互式数据探索,可视化和演示,从而鼓励直观的即席报告。
了解Google图表
Google Charts 是一个基于JavaScript的纯粹图表库,旨在通过添加交互式图表功能来增强Web应用程序。
学习Hadoop
Hadoop是一个开放源代码框架,允许使用简单的编程模型在跨计算机集群的分布式环境中存储和处理大数据。
学习Power BI
Power BI是一种数据可视化和商业智能工具,可以将来自不同数据源的数据转换为交互式仪表板和BI报表。
学习QlikView
QlikView是领先的业务发现平台。
学习R编程
R是用于统计分析,图形表示和报告的编程语言和软件环境。
学习SAS
SAS是业务分析领域的领导者。通过创新的分析,它可以满足商业智能以及数据管理软件和服务的需求。
学习Spark SQL
Apache Spark是专为快速计算而设计的闪电般的集群计算。它建立在Hadoop之上。
学习统计
该统计准备材料将涵盖统计学教学大纲的重要概念。本章包含讨论统计的所有基本概念的章节,


